
ITC stock experienced its largest one-day decline since October 19, 2021, as shares dropped by almost 4% on Monday. Following the drop in US markets on Friday, the Indian indices opened negatively and fell nearly 2%. The Nifty50 ended the day at 17,016.30, a loss of 311 points, or 1.80 percent. Similarly, the Sensex fell 954 points (1.64%) to 57,145.22.
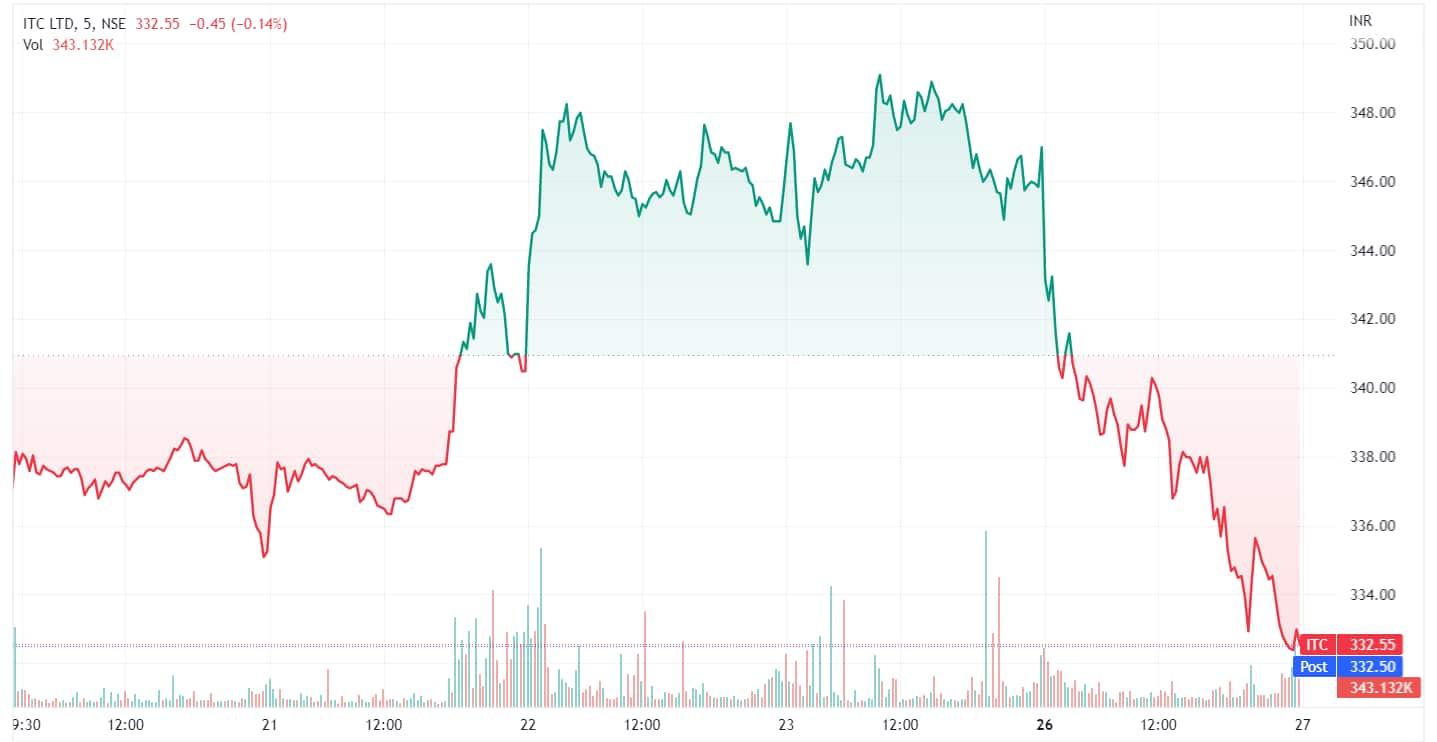
During Monday's intraday, the ITC opened with a gap down of ₹1.50 at ₹344.85 and continued to fall, reaching an intraday low of ₹332.15, before closing at ₹332.55, down 3.98% from its previous close of ₹346.40.
The stock touched a 52-week-high of ₹349.6 on September 23rd, 2022, and a 52-week-low of ₹207 on February 24th, 2022, indicating that at the current level the stock is trading 62% higher than its 52-week low.
Over the past few years, ITC Ltd. has consistently underperforming in the markets, but this changed in 2022 after it surged by 53%. The rally in ITC began in early March and since then the stock has experienced a one-way spike by surging from ₹208.50 to ₹335.65 levels, delivering an extraordinary return of 60 percent in just seven months.
Domestic brokerage firms still believe the stock has still a long way to go from here. Centrum Broking expects the stock has the potential to hit a high of ₹424, which is a 27.49% upside from the stock's September 26 closing price.
On the technical charts, ITC is trading higher than its 20, 50, 100, and 200-day moving averages. At current levels, the stock is trading above the signal line of the MACD (Moving average convergence divergence). The RSI of the stock stands at 78.80, well above the 70 levels, which is considered the overbought zone.
After hitting a 52-week high of 45,080.90 on September 22, 2022, the Nifty FMCG index fell by 917.25 points, or 2.24% to 43,937.40, on Monday.
The FMCG stocks took a little breather after the commodity prices started falling slowly, and adding to that, the revival of rural consumption has also boosted FMCG stocks. The Demand in rural India for fast-moving consumer goods grew 6.7 percent in value in August, while urban areas registered a value growth of 5.5 percent over July, as consumption in rural areas increased due to normal and above normal monsoons in most parts of the country, Business Standard reported quoting Bizom data.
ITC Limited posted a consolidated net profit of ₹4,389.8 crore for the quarter ended June 30, which was up 33.97 percent year-on-year (YoY) as against ₹3,276.5 crore reported during the corresponding quarter in the year-ago period. The revenue from operations for Q1 of FY2023 stood at ₹18,810.2 crore versus ₹14,687.8 crore, which was up nearly 28 percent YoY.
Meanwhile, ITC saw its FII holdings rise from 12.7% in March 2022 to 12.7% in the June 2022 quarter. while the regular shareholders held the largest share, with a 44.5% stake, Trendlyne data showed.
An average of 34 analysts polled by MintGenie have a 'buy' call on the stock.
Disclaimer: The views and recommendations made above are those of individual analysts or broking companies, and not of MintGenie.