
After three consecutive days of losses, market barometer Sensex surged over a percent in intraday trade on January 9, thanks to positive global cues after a raft of US macroeconomic data fuelled hopes of a pause in rate hikes by the US Fed.
But there is no certainty that the weak macro numbers will push the Fed to take a pause, for in the minutes of the last policy meet, Fed warned that the market is underestimating its resolve to keep rates high for a long time in its fight against inflation.
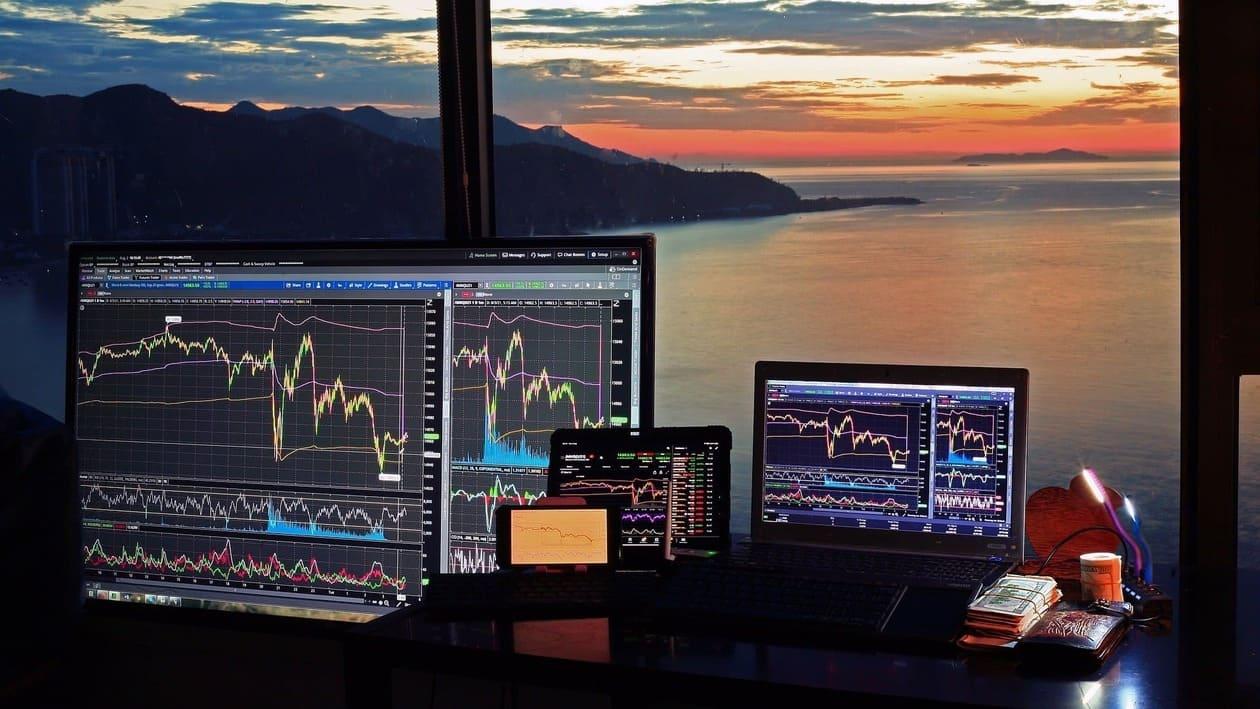
Volatility is expected to continue in the short term. A prudent investor, however, can still find opportunities in some stocks which are fundamentally and technically sound.
Analysts recommend the below mentioned 9 stocks for the short term. They think one can buy these stocks for the next 3-4 weeks as they look attractive on the technical charts.
Analyst: Vaishali Parekh, Vice President - Technical Research, Prabhudas Lilladher
After the short correction, this stock has indicated a reversal, taking support near the significant 50 EMA (exponential moving average) level of ₹1,370.
After the consolidation, the stock moved with improved bias on the daily chart, suggesting strength building up.
Momentum indicator RSI is also flattening out after the correction with signs of improvement.
This stock has made a decent correction from the levels of ₹3,450 to ₹2,650. It has taken support after consolidating near the 200 DMA (daily moving average) level of ₹2,670.
Currently, with a positive candle pattern on the daily chart, the bias has improved and there are chances of a decent pullback from hereon.
With rising volume participation and the RSI recovering from the oversold zone, the chart looks quite attractive for further upward movement.
The stock saw a short correction from ₹603 to ₹516. Post that, it saw a decent pullback, improving the bias on the daily chart, with the price moving past the trendline zone of ₹570.
With rising volume participation and the RSI recovering from the oversold zone, the chart looks quite attractive for further upward movement.
Analyst: Jigar S. Patel, Senior Manager - Equity Research, Anand Rathi Share and Stock Brokers
For nearly last five months, this counter has been making ‘lower highs and lower lows’ structure. Recently, it started changing its structure by making higher highs and higher lows and also broke its five-month-old trendline.
At the current juncture, it sustained above 50 DEMA. Buying volume is picking up from lower levels. For the last five trading sessions, there has been nice buying interest.
Daily DMI (Directional Movement Index) has given a bullish cross along with daily MACD displaying a bullish cross near zero line, hinting at an upside in the counter.
From June 2022 to date, PNB has given a whopping return of nearly 130 percent. At the current juncture, it is sustaining above its historical resistance of ₹55 which is adding strength to the counter.
Weekly DMIs have made a super bullish structure while volume is rising along with the prices which is a very positive indication for further upside in the counter.
The free fall from July 2022 to October 2022 resulted in a 47 percent decline in price. On the daily scale, the counter has formed ‘higher highs and higher lows’ structure indicating bulls are taking control over bears.
For the last five trading sessions, the counter has been witnessing some selling with almost negligible volume.
It indicates that the fall might get arrested around ₹480. In recent times, every big upside in the counter is accompanied by massive volume, hinting towards an upside in the counter.
The daily DMI has formed a bullish crossover which further confirms the upside in the counter.
"One can buy in small tranches at the above-mentioned levels and buy another tranche at around ₹475-480 levels (if tested). The upside is expected till ₹600," said the analyst.
Analyst: Sumeet Bagadia, Executive Director, Choice Broking
The stock has crossed its short-term moving average of 20 DMA, confirming strength in the counter.
RSI has shown a positive crossover and is trading at 55, indicating momentum is picking up.
The sock has formed a 'morning star' pattern on the weekly chart. It is trading with support at the middle Bollinger Band, indicating price may bounce back in the coming days.
"One can initiate a long position at the current market price. Closing and sustaining above ₹1,280 will lead to ₹1,325-1,335 levels in the coming days," said the analyst.
Britannia has corrected from its record high of ₹4,537 and has retested a key support level of ₹4,230 which is also its 50-day EMA.
The stock's immediate resistance is at ₹4,450. Once the stock crosses this barrier, it may continue to rise toward the levels between ₹4,550 and ₹4,600.
The RSI indicator is at the level of 53 which provides support for the stock to climb higher.
At the current levels, the stock is trading above the 20-day EMA which shows a positive signal and can move towards the target.
"With a medium-term target price of ₹4,550, we advise purchasing Britannia at the current market price. It can also be accumulated close to ₹4,300. If the price closes below ₹4,250, our analysis will be invalid," said the analyst.
M&M has been in a strong consolidation zone for the last six months. The stock has a strong support zone around the ₹1,220-1,230 zone, which is also supported by a 200-day EMA.
There is a downward-sloping trendline with a slight resistance near ₹1,280 on the daily chart. Once it overcomes this resistance and maintains above the indicated levels, the stock would ride on the higher side.
The RSI Indicator is at a comfortable level of 50, indicating that the stock has the potential to rise higher.
The stock has gone above the middle of the Bollinger band and has respected the support level of ₹1,210 which is the lower band.
"Based on the above technical structure, we recommend a buy at ₹1,264 where ₹1,250 will also be an averaging opportunity for the targets of ₹1,330 to ₹1,345 with a stop loss of ₹1,220," said the analyst.
Disclaimer: The views and recommendations given in this article are those of individual analysts. These do not represent the views of MintGenie.