


The stock market surge is not always a reflection of economic growth. Sometimes, it is driven primarily by liquidity. On September 16, 2021, when Sensex hit 59,000, market regulator SEBI’s chairman Ajay Tyagi cautioned investors of a liquidity-driven market rally. That time, the Sensex P/E (price/earnings) ratio had hit 30, which means the stock prices were 30 times of annual earnings from the stocks.
During that time, the valuation of the Indian stock market moved past that of France, becoming the sixth largest in the world with a market cap of $3.4055 trillion.
Liquidity driven rally
Liquidity rally is not an uncommon phenomenon which takes place when too much cash in the hands of investors trigger an increased demand of stocks followed by an increase in prices.
The rally seen in August 2020 after the first wave of COVID abated was also liquidity-driven as the newly jobless employees had started betting on stock markets. That time, NIFTY P/E hovered around 30 – historically a high ratio for the market index, indicating overpriced stocks.
While talking about the liquidity-driven rallies, Sanjiv Chainani, managing director of Value Line Advisors, wrote in Business India that the investors need to be cautious during such rallies.
The cash infusion of foreign institutional investors (FIIs) in 2021 also played a role in the rally steered by liquidity. In the financial year 2020-21, FIIs inflows were highest ever at $37.6 billion, more than the corresponding inflows of six preceding years put together.
Macro factors
Experts often suggest investors to look at the macro-economic data to dispel any wrong impressions drawn from the stock market rally. Taking a close look at the growth numbers of June quarter, 2021 reveals that the GDP grew by 20.1 percent, a high increase by any measure. However, in absolute terms, the GDP is 9.2 percent lower than that of pre-COVID period of 2019-2020.
Financial ratios
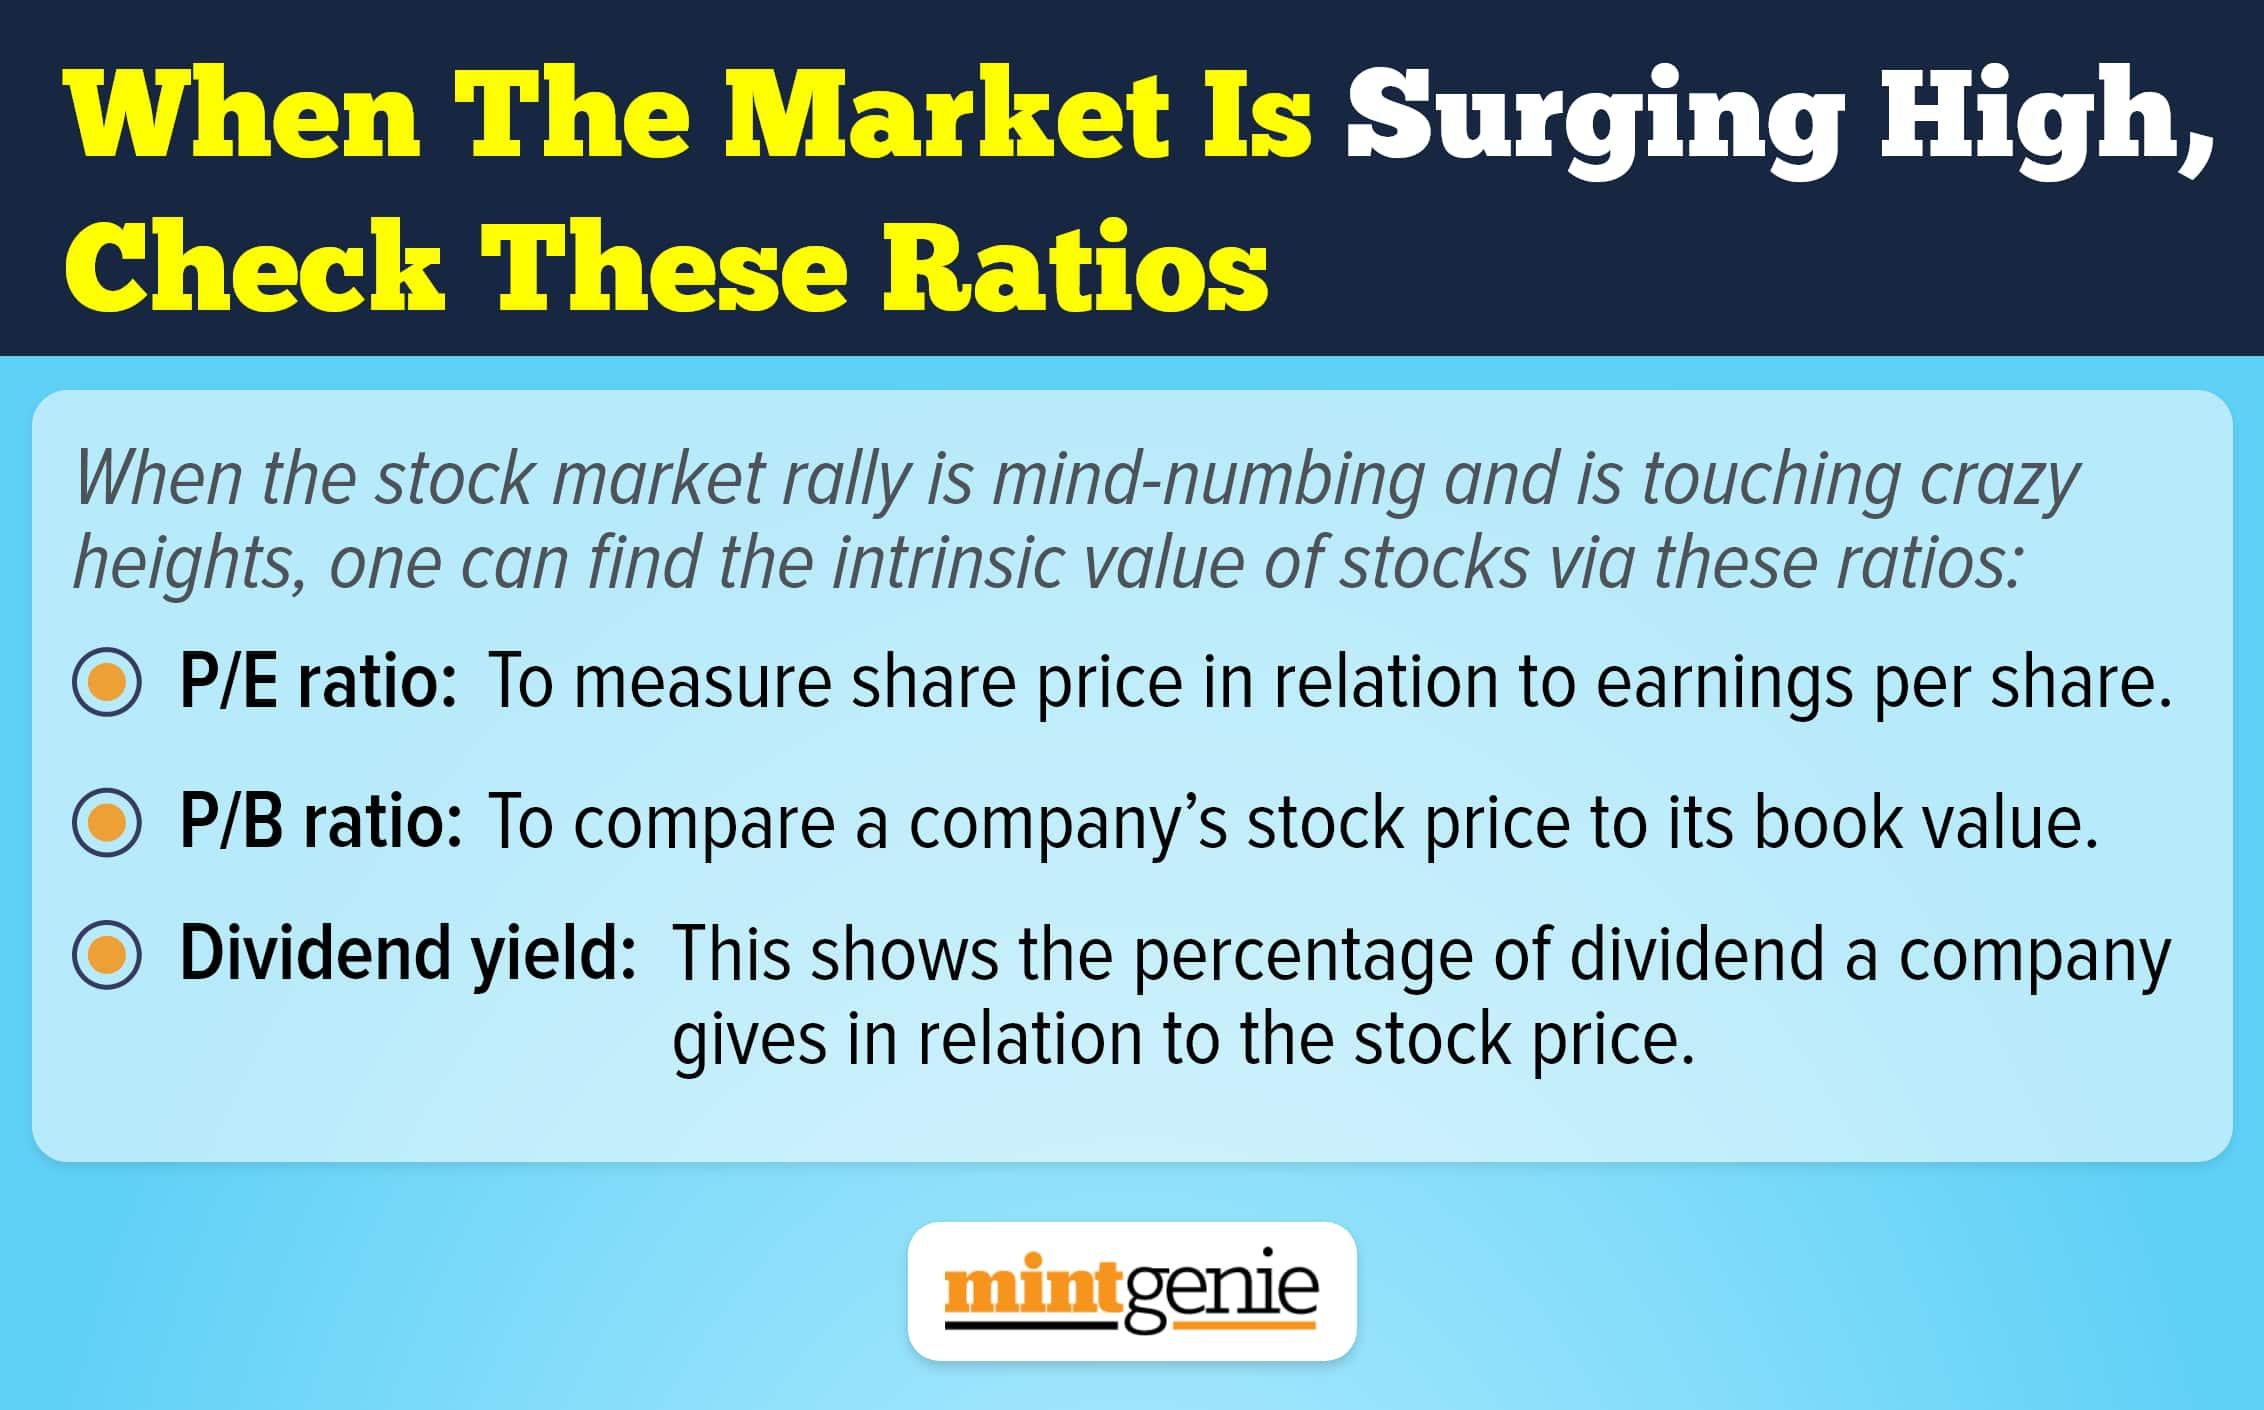
To put the stock market prices in perspective, it is advisable to look at some of the key ratios that show if the market prices are high or not. These ratios include:
1. P/E ratio (price to earnings ratio): This is the ratio to measure share price in relation to earnings per share. The P/E ratio of Sensex in the 2021-22 financial year (September 2021) was 30.36 whereas the corresponding figures in the previous two years (Sep 2020 and Sep 2019) stood at 28.09 and 26.36, respectively. This clearly shows that the Sensex stocks have got pricier in the past two years.
2. P/B ratio (price to book value): This is meant to compare a company’s stock price to its book value. The P/B ratio of Sensex in the 2021-22 financial year (in September 2021) was 3.72 whereas the corresponding figures in the previous two years (Sep 2020 and Sep 2019) stood at 2.89 and 2.83, respectively. This also shows that the stock prices have become expensive when compared with last year.
3. Dividend yield: This shows the percentage of dividend a company gives in relation to the stock price. It is calculated by dividing price per share by annual dividend per share. If a company gives ₹10 as dividend on a share priced at ₹100, the dividend yield will be 10/100 X 100 = 10 percent.
So, the higher the stock price, the lower the dividend yield. For instance, in September 2021, when the Sensex hit an all-time high of 59,000, the dividend yield was 0.93 while the corresponding figures for the past two years (Sep 2020 and Sep 2019) were 1.01 and 1.23, respectively.
4. PEG Ratio (Price/ Earnings to growth): This can be calculated by dividing growth rate of stock’s earnings by P/E ratio. This is used to gauge stock’s value while also incorporating expected growth of earnings. This ratio is believed to provide a more holistic view than the P/E ratio.
We can conclude by highlighting that the stock market valuations can be misleading, especially when they are liquidity-driven and not value-led. The investors ought to look at the true worth of stocks and indices via financial ratios such as P/E ratio, P/B ratio, dividend yield and PEG ratio.