

Outperforming the bull run by the Indian markets, rail stock Rail Vikas Nigam Limited (RVNL) has given exceptional returns to its investors. In the last 1 year, the stock has skyrocketed 383 percent. Meanwhile, in 2023 YTD as well, it has given multibagger returns, soaring over 143 percent.
Stock Check: Up 383% in last 1 year, is RVNL still a good ‘buy’?
TL;DR.
RVNL has seen a surge in its stock price driven by significant order wins and a capital outlay for Indian Railways.
In comparison, the Nifty50 index rose 11.5 percent in the last 1 year and 10.9 percent in 2023 YTD
The stock jumped over 29 percent in September so far, extending gains for the seventh straight month since March. In these 7 months, the stock rallied 195 percent. However, February was the only month when the stock was in the red, down over 24 percent. In January, it was again in the green, up 11.5 percent.
Earlier this week (September 12), the stock hit its record high of ₹199.35. Currently trading at around ₹170, the stock has soared over 418 percent from its 52-week low of ₹32.80, hit on September 29, 2022.
The stock debuted on Indian exchanges on April 11, 2019, with a listing price of ₹19.10. The shares have seen an impressive growth of 794 percent over the issue price of ₹19.

RVNL Stock
Reasons behind the recent surge
The recent rally in the rail stock is primarily driven by significant order wins, which are a result of the ongoing transformation within the railway sector.
During Union Budget 2023-2024, the government announced a capital outlay of ₹2.40 lakh crore for the Indian Railways, the highest ever outlay and about 9 times the outlay made in 2013-14.
Earlier this month, the company announced its latest order win worth ₹322 crore from Madhya Gujarat Vij Company.
Meanwhile, in July, the company emerged as the lowest bidder for various Maharashtra Metro Rail Corporation Limited projects. These projects include the construction of six elevated metro stations, one elevated and one at-grade station, an elevated metro track supporting structure, and a multi-story building.
The combined estimated cost for these projects stands at ₹256.19 crore, as reported in the company's exchange filing.
The company also received a Letter of Award from the Haryana Rail Infrastructure Development Corporation (HRIDC) in July, for a project worth ₹1,088 crore, and in the same month, it received an order worth ₹808.4 crore from NHAI for a road project in Odisha.
Then in June, it was awarded three orders worth ₹11,256 crore from the Chennai Metro Rail Ltd. These orders are for the construction of underground stations in the Phase II project.
These significant order wins have been instrumental in driving the stock's consistent upward trajectory.
About the firm
Incorporated in 2003 by the Ministry of Railways (MoR), it is a wholly-owned government company, a Miniratna (Category – 1) Schedule ‘A’ Central Public Sector Enterprise.
The company focuses on executing all types of railway projects, including new lines, doubling, gauge conversion, railway electrification, metro projects, workshops, major bridges, construction of cable-stayed bridges, and institution buildings.
Earnings
In the June quarter, the firm posted a 15 percent year-on-year jump in its consolidated net profit to ₹343 crore versus ₹297.6 crore during the corresponding quarter last fiscal. Its revenue from operations also rose 20 percent YoY to ₹4,640.7 crore as against ₹5,571.5 crore during Q1FY23.
However, sequentially, the company's net profit fell 4 percent and revenue from operations declined 2 percent.
Fundamental Views
No brokerage house has yet initiated coverage on this rail stock for fundamental views.
Technical Views
Pravesh Gour, Senior Technical Analyst, Swastika Investmart
The counter witnessed a breakout of upward-sloping channel formation at the ₹147 level with strong volume, then it retested its last breakout level of Rs. 147 and then moved towards ₹199 levels, but from the higher levels it has faced a profit booking.
Investors have to apply a buy-on-dip strategy, as it is still trading above all its important moving averages. On the downside, ₹147 is a strong demand zone during any correction. On the upside, ₹180 is the immediate hurdle; above this, we can expect a move towards ₹200+.
Gaurav Bissa, VP, InCred Equities
RVNL has been in a very strong uptrend after consolidating for a couple of months. The stock witnessed a strong rise after retesting the ascending channel pattern on the weekly charts. The volumes in the current run have been extremely strong. However, RSI entered an extreme overbought zone on daily charts and formed a double top pattern which put some pressure on the stock price which corrected from 190 to below 170 levels. The stock has a major support at the 150 level which is the breakout retest on short-term charts. The stock is expected to resume an uptrend towards 200 if it holds 150 levels.
Rajesh Palviya, SVP - Technical & Derivatives Research, Axis Securities
The stock is in a strong uptrend, forming a series of higher tops and bottoms across all the time frames, indicating bullish sentiments. Huge rising volumes on each rally signify increasing participation. The stock is well placed above its 20, 50, 100 and 200-day SMA, and these averages are also inching up along with a price rally, which reconfirms positive bias. The stock has experienced a multi-month breakout at 147 and sustained above the same on the monthly time frame. Hence, any short-term corrections towards 147-140 levels remain a buying and accumulation opportunity. This momentum may extend towards 230-270 levels in upcoming quarters.
Ashwin Ramani, Derivatives Analyst, SAMCO Securities
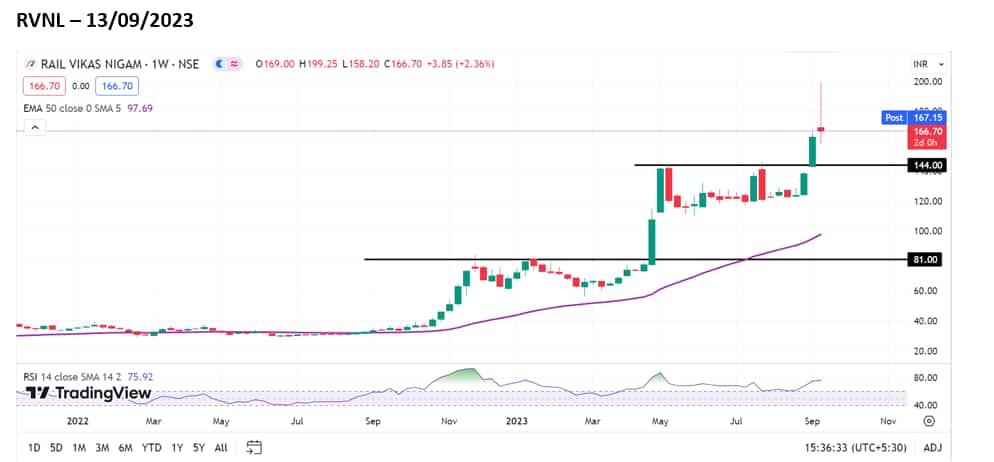
A long-legged doji candle is visible on the weekly chart, which is considered to be a neutral candlestick pattern, said Ashwin Ramani.
A long-legged doji candle is visible on the weekly chart, which is considered to be a neutral candlestick pattern. The Relative Strength Index (RSI), a momentum indicator, is moving in a lower high formation contrary to the price which is moving in a higher low formation, indicating negative divergence. The previous resistance level of 144 is likely to act as a support for the stock going forward. If the price holds above the 144 level, then we may see the stock moving north until the 205 level in the short term.
Disclaimer: The views and recommendations made above are those of individual analysts or broking companies, and not of MintGenie. We advise investors to check with certified experts before taking any investment decisions.
First Published: 14 Sep 2023, 12:09 PM IST
