


Indian indices started the week on a high note, rising 1 percent on Monday. However, some consolidation was witnessed in today's (Tuesday) trade with the indices trading in a range-bound fashion.
According to brokerage house Axis Securities, the chart pattern suggests that if the Nifty crosses and sustains above the 17,200 level it would witness buying which would lead the index towards 17,400-17,700 levels.
However, it added that if the index breaks below the 17,000 level during the week, the Nifty would witness selling which would take the index towards 16,800-16,600.
For the week, Axis expects Nifty to trade in the range of 17,700-16,600 with a positive bias. The daily and weekly strength indicator RSI is moving upwards and is quoting above its reference line indicating positive bias, it further informed.
Against this backdrop, the brokerage has come out with its top weekly picks. Let's take a look:
CMP: ₹710 | Buy Range: ₹705-690 | Stop Loss: ₹660 | Upside 10-15%
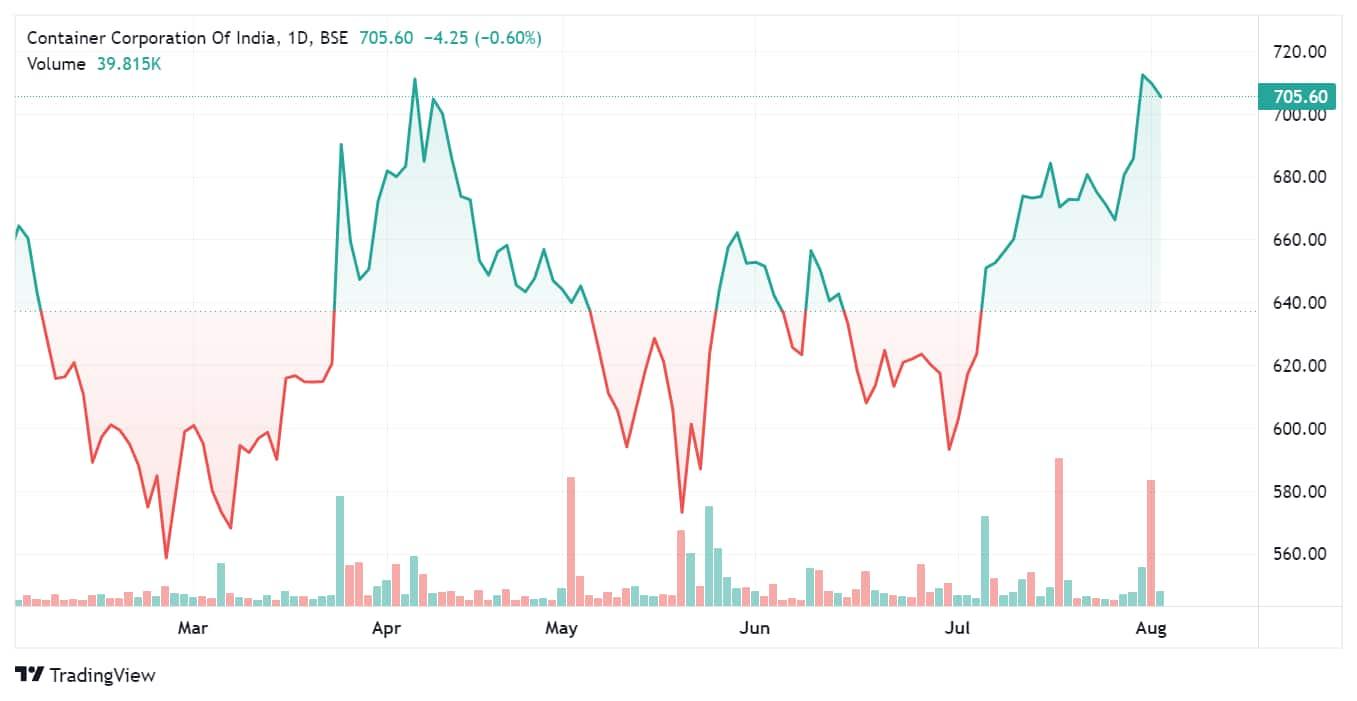
The brokerage said that on the weekly time frame the stock has decisively broken out one year “down-sloping trend line” at 690 levels. On the daily and the weekly time frame, the stock has entered an up trend forming a series of higher tops and bottoms, it added.
"The stock is well placed above its 20, 50, 100 and 200 day SMA which reconfirmed bullish trend. The daily and weekly strength indicator RSI is in bullish mode along with positive crossover which supports rising strength in the near term," noted Axis. The above analysis indicates an upside of 765-800 levels, it estimates.
Gujarat Narmada Valley Fertilizers and Chemicals
CMP: ₹720 | Buy Range: ₹710-695 | Stop Loss: ₹660 | Upside 11-16%
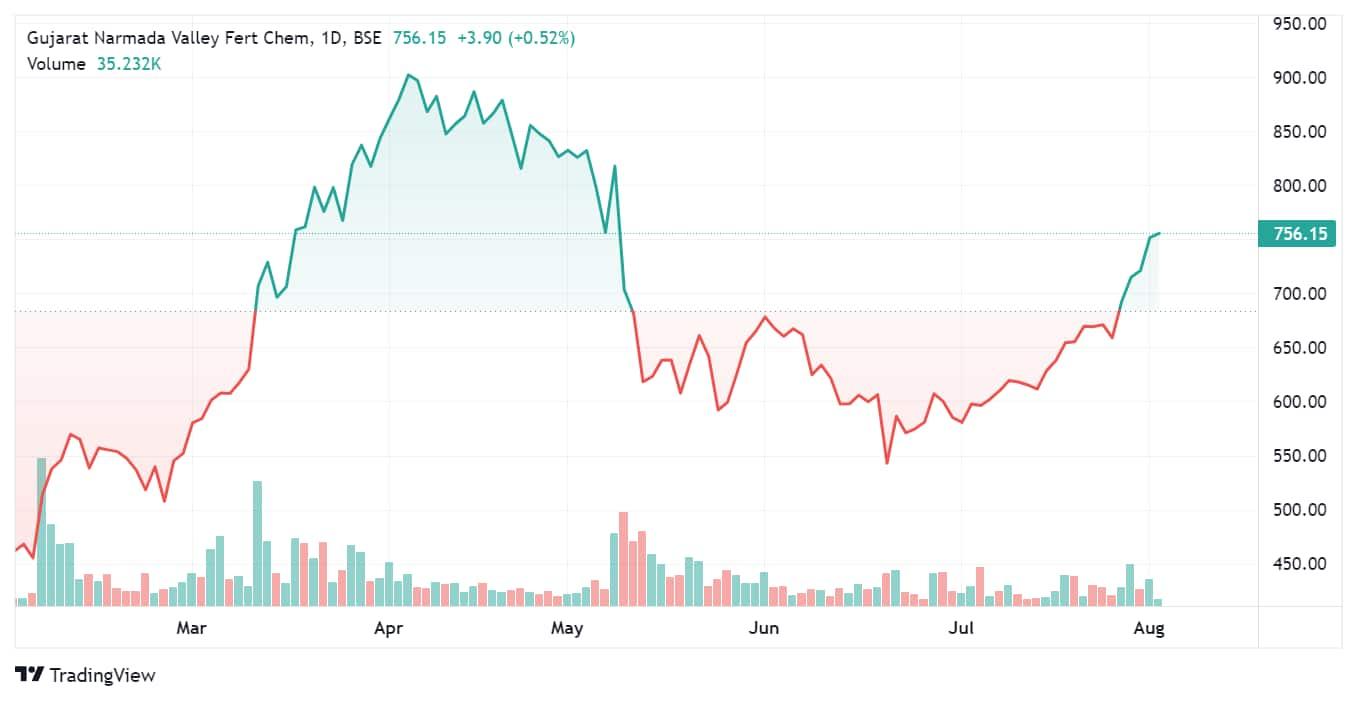
On the daily time frame, the stock has observed a “rounding bottom” breakout at 700 levels along with rising volumes, the brokerage pointed out. It said that the stock has recaptured its 200-day SMA and rebounded sharply and the positive crossover of 20 and 50-day SMA signals bullish sentiments in the near term.
"On the weekly time frame, the stock is trending higher forming a series of higher tops and bottoms. The daily and weekly strength indicator RSI is in positive terrain and sustaining above 50 mark indicating sustained strength," it noted. The above analysis indicates an upside of 780-815 levels with a holding period of 3-4 weeks, stated Axis.
CMP: ₹1,965 | Buy Range: ₹1,945-1,905 | Stop Loss: ₹1,840 | Upside 9-12%
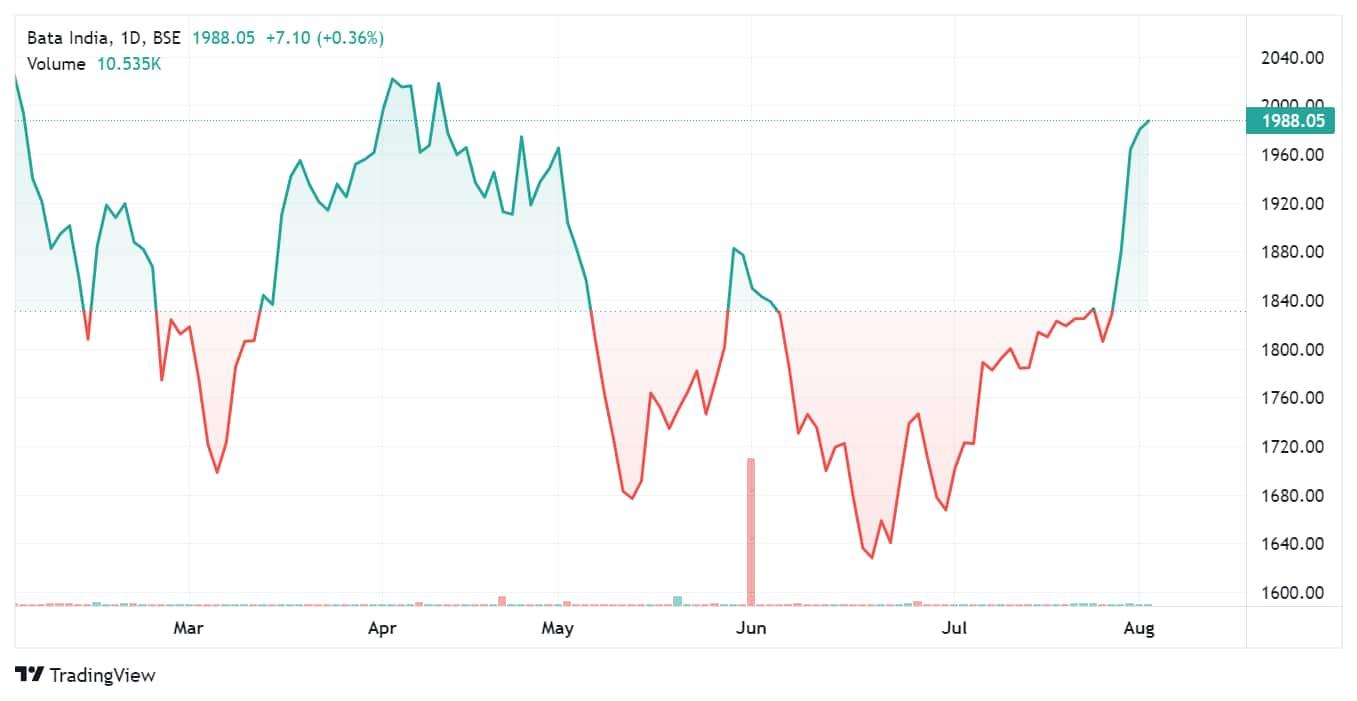
On the weekly chart, the stock has confirmed ten-month “down-sloping channel” breakout around 1,880 levels, noted Axis, adding that its rising volumes at the breakout zone indicate increased participation. It further informed that the stock is well placed above its 20, 50, 100 and 200-day SMA’s and sustaining the above reconfirms bullish sentiments.
The daily “band Bollinger” buy signals also indicate increased momentum while the daily and weekly strength indicator RSI continue to remain bullish which signals sustained and rising strength. The above analysis indicates an upside of 2,100-2,150 levels, forecasts Axis.
CMP: ₹212 | Buy Range: ₹210-205 | Stop Loss: ₹195 | Upside 12-17%
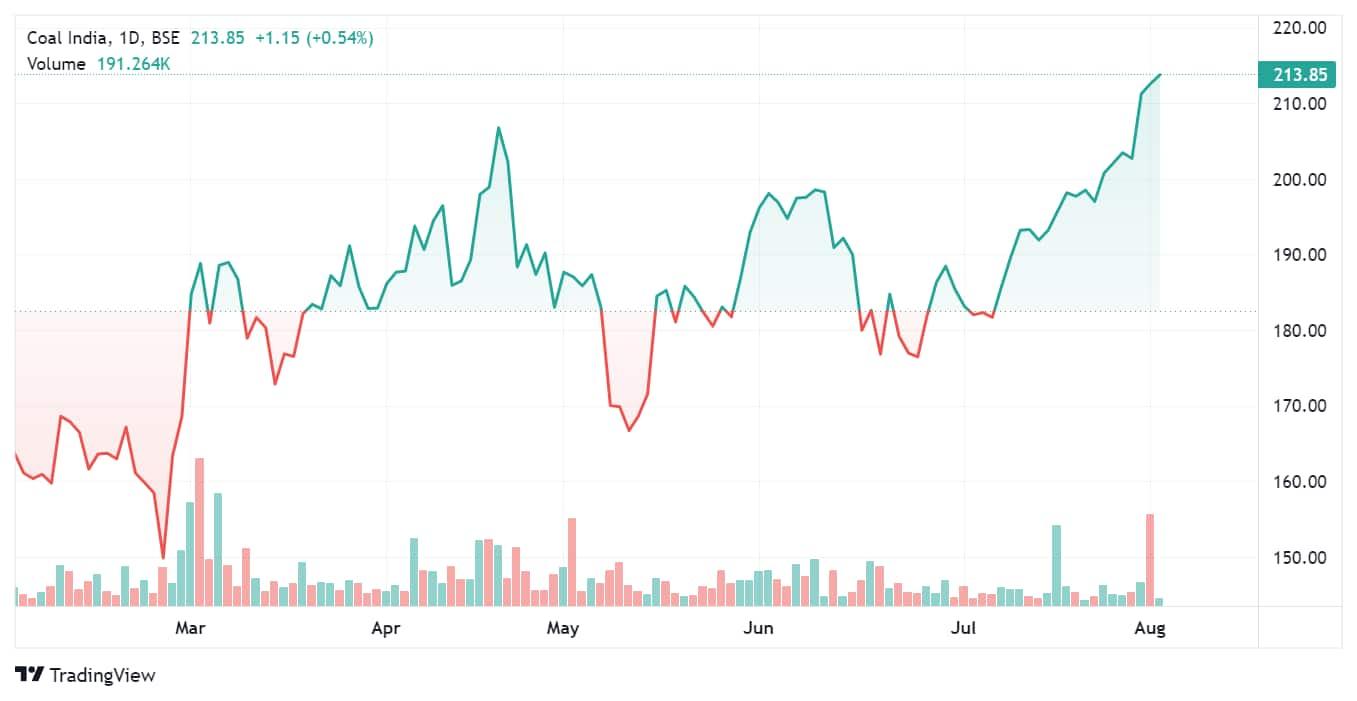
On the weekly chart, the stock has confirmed a “multiple resistance“ breakout at 205 levels and this breakout is accompanied with a huge volume spurt indicating increased participation at the breakout zone, said Axis. It also noted that the stock is well placed above its 20, 50,100-day and 200 SMA support zone which reconfirm bullish sentiments.
The daily and weekly “band Bollinger” also signals increased momentum while the strength indicator RSI is also in the bullish mode which supports rising strength. The above analysis indicates an upside of 232-242 levels with a holding period is 3 to 4 weeks, it noted.