

The Nifty Realty index has risen around 13 percent in the last 1 year. The stock advanced over 17 percent in July and added 2 percent in August.
Technical View: Why Motilal Oswal believes its time to buy realty; Here are its 2 stock picks
TL;DR.
According to domestic brokerage house Motilal Oswal, the Nifty Realty Index has formed a strong base and it has given a consolidation breakout of the last 11 years since 2011. It has successfully retested the same and started a fresh move towards higher levels.
Since June the index has soared 25 percent, however, before this recent recovery, the index fell around 30 percent between October 2021 - June 2020.
Experts believe that while the housing segment continues to witness strong demand well supported by tailwinds from the fundamental demand drivers, rate hikes, rise in raw material prices and weak macro are key concerns for the sector.
Technical View
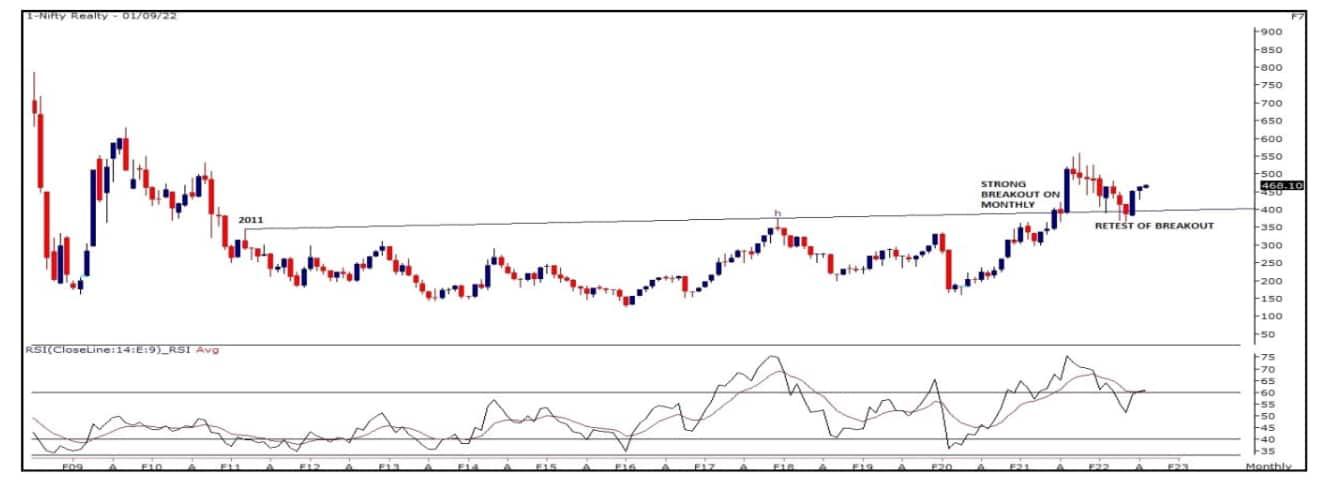
Nifty Realty Technical chart
According to domestic brokerage house Motilal Oswal, the Nifty Realty Index has formed a strong base and it has given a consolidation breakout of the last 11 years since 2011.
It has successfully retested the same and started a fresh move towards higher levels. It has formed a strong bullish candle on the monthly scale and follow-up buying is visible which will support a higher level in the near term, noted the brokerage.
On the weekly scale, the brokerage said that the index has given a breakout of the falling channel which has positive implications.
"The momentum indicators on the weekly and monthly scale are placed in the bullish zone which will take the prices to higher levels of 530 and 560 zones whereas support on the lower side is placed at 440 and 410 zones," predicted MOSL.
As per MOSL, there is relative strength in the Realty sector which is likely to start a fresh rally in the near term. Its top picks where outperformance is likely are Oberoi Realty and DLF.
Stocks
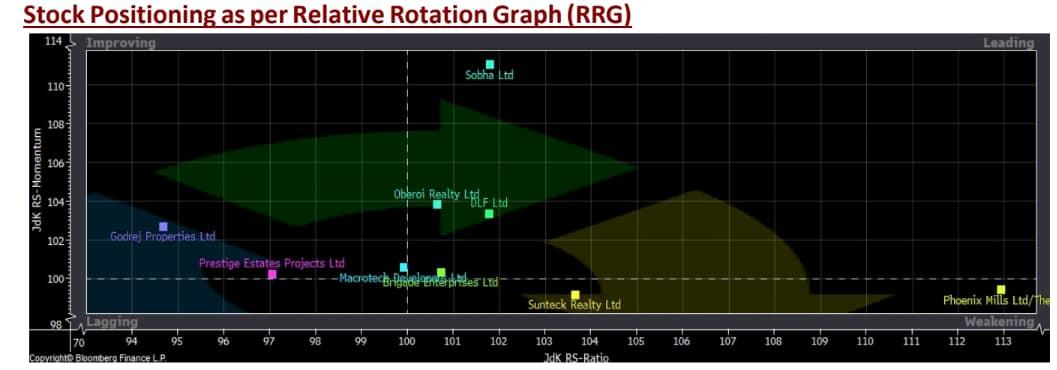
The brokerage further stated that the analysis of the Relative Rotational Graph of the Realty sector shows that Oberoi realty, DLF, Sobha and Brigade Enterprises are in the Leading quadrant and will outperform. Godrej Properties, Prestige Estates and Macrotech developer are in the Improving quadrant which indicates that the stock can pick momentum for higher zones, it added.
It is important to note that the Relative Rotation Graphs chart shows the relative strength and momentum of a group of Indices. It allows a comparison of sectors against the benchmark to see if it is outperforming or underperforming the benchmark. It is derived from Relative strength in which the value of a sector is divided by the value of the index mainly a benchmark that allows us to compare the performance of the sector.
Source MOSL Report
Relative strength ratio
The brokerage informed that the Relative Strength ratio is normalized to oscillate around 100 (plotted on the X axis) i.e RS (Relative Strength) Ratio along with this it provides the speed and direction of the Relative strength ratio (plotted on the Y axis) i.e RS- momentum.
"The scatter plot is divided into four quadrants. Leading quadrant which indicates the positive strength and positive momentum which means it is outperforming the benchmark. The next one is the Weakening quadrant which denotes positive strength but momentum declines as the stock is still outperforming the index but at a declining rate. The third quadrant is Lagging in which strength and momentum both decline and underperform the benchmark index. The fourth quadrant is Improving in which strength is still low but momentum will start improving," it explained.
Top Picks
Oberoi Realty: As per the brokerage, the scrip shows a fresh breakout of the consolidation zone on the weekly scale. The brokerage sees upside potential of 21 percent for the stock. The stock added 15 percent in the last 1 month and 30 percent in the last 1 year.
"On the weekly scale, the stock is giving a breakout of the consolidation zone since November 2021. The stock has been making higher highs since the last 3 months which indicates a strong uptrend. The momentum indicators are placed in a positive zone which will take the prices to higher levels of 1,130 and 1,250 On the lower side the supports are placed at 990-900," said the brokerage.
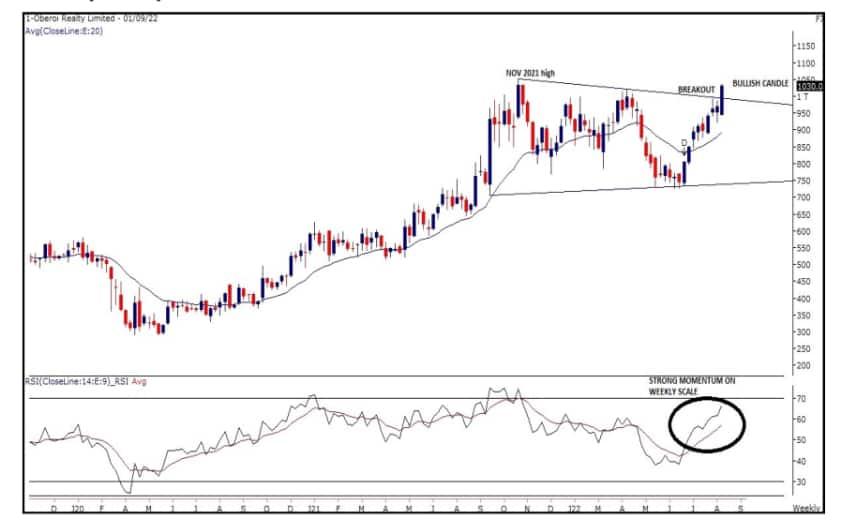
Oberoi Realty price chart
DLF: Retest of the breakout on a monthly scale and start of fresh up move
The brokerage sees upside potential of 25 percent for this realty stock. The stock added 7 percent in the last 1 month and 7 percent in the last 1 year. According to MOSL, the stock has retested the 11-year breakout on the monthly scale and has formed a strong bullish candle in the month of July.
There is a breakout of the falling supply trend line for the first time after October 2021 on the weekly scale and follow-up buying is visible which will take the price to a higher level RSI oscillator is also very well placed on the weekly and monthly charts which will support the up move towards 430 and 500 zones, while support on the lower side is placed at 380 and 360 zones, it stated.
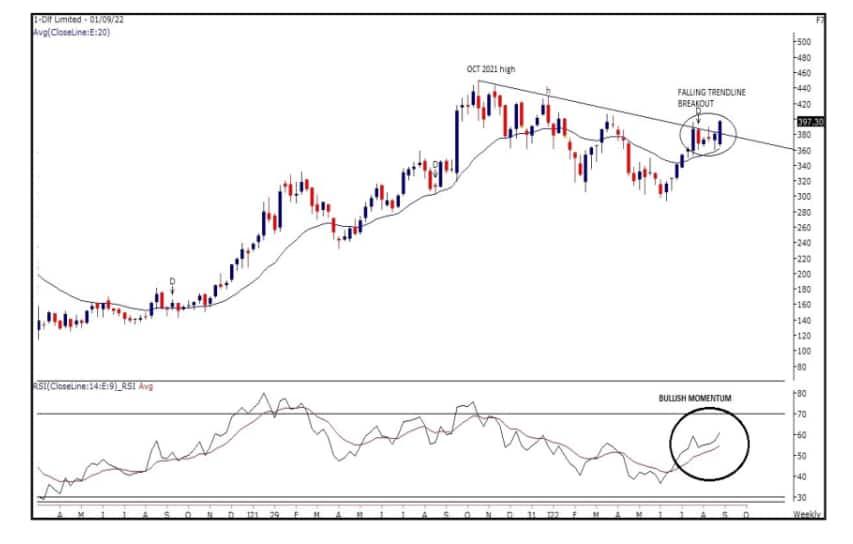
DLF Price Chart
Disclaimer: The views and recommendations given in this article are of the broking firm. These do not represent the views of MintGenie.
First Published: 06 Sep 2022, 01:14 PM IST
